 By
What counts as deforestation under the EUDR?
Regulation (EU) 2023/1115 defines deforestation as the conversion of forest to agricultural use, whether human-induced or not (Art. 2(3)). Forest is land of more than 0.5 ha with trees higher than 5 m and a canopy cover of more than 10%, or trees able to reach those thresholds in situ, excluding land that is predominantly under agricultural or urban use (Art. 2(4)). The date that matters is 31 December 2020: the commodity has to come from land that was not deforested after it.
Two practical consequences. A palm or cocoa plantation that already existed in 2020 does not become deforestation when it is renewed, because it was already agricultural land. And for timber you also have to look at forest degradation (Art. 2(7)), which is not the same as losing trees.
The operator has to collect adequately conclusive and verifiable information that the product is deforestation-free (Art. 9(1)(g)). The Regulation does not impose a particular map, so the real question is a different one: which sources you use, what each tells you and how you reach a conclusion you can show. The technical detail of each layer is in the satellite check guide; this one is about the method for deciding.
What does each public source look at?
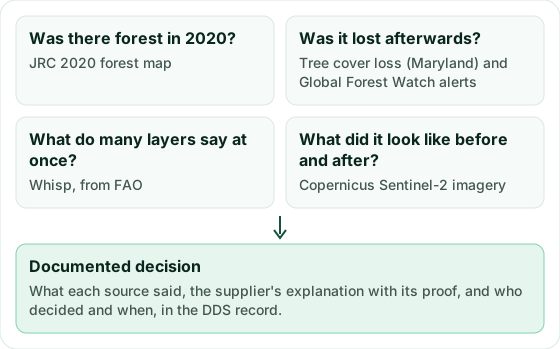
Each source answers a different question and has a blind spot. None is enough on its own, and together they cover a lot:
| Source | Question it answers | What it does not tell you |
|---|---|---|
| JRC 2020 forest map | Was there forest on the plot at the end of 2020? | It does not see later changes and leaves out agricultural tree crops such as palm, rubber or cocoa. |
| Tree cover loss (University of Maryland) | In which year was tree cover lost? | It does not tell a plantation harvest from deforestation. It comes out once a year. |
| Global Forest Watch integrated alerts | Has anything happened in recent weeks? | They do not measure area, and their confidence varies from one alert to another. |
| Whisp, from FAO | What do many layers say at once, for this type of crop? | It is a risk assessment, not a measurement. It can answer that it needs more information. |
| Copernicus Sentinel-2 imagery | What did the plot look like before and after? | It has to be interpreted, and clouds hide it. |
The first four are layers crossed with the plot's geometry. The fifth is the image itself, which lets you check with your own eyes what the layers say. Sentinel-2 has an archive going back to 2015 and a resolution of 10 m, so there are images from before the cut-off date for almost any place.
Sourevo checks your suppliers’ plots by satellite and puts them in the DDS. Try it free for 14 days, no card needed. Try it free for 14 days
Why do the sources not always agree?
Two sources saying different things about the same plot is normal, and there is almost always an explanation you can check:
- Plantation or forest. Tree cover loss measures trees, not land use. Harvesting an acacia or eucalyptus plantation, or renewing an old palm or rubber plantation, shows up as loss even though the plot is still what it was in 2020.
- Different definitions. The JRC map leaves out agricultural tree crops, so an old palm plot shows no forest in 2020 while Maryland records loss from the replanting. Both are true at the same time.
- Resolution. Maryland works with 30 m pixels and the JRC with 10 m. At the edge of a small plot, a road or a neighbour's clearing can fall inside.
- Clouds and dates. Optical images cannot see through clouds, and the yearly data arrive months late. A recent alert may not have its year of loss yet, or the other way round.
- Geometry. If the supplier's GeoJSON is shifted or has latitude and longitude swapped, every source looks at the wrong place and they agree on a mistake.
That is why the first check when sources disagree is not a new map but the plot itself: that it is where the supplier says and the size the supplier says.
How do you look at Sentinel-2 images yourself?
Images from the EU's Copernicus programme are free and open, and the public Copernicus viewer (Copernicus Browser) shows them without installing anything. For a plot in doubt, this is enough:
- Open the plot in the viewer, by loading its outline or going to its coordinates.
- Pick a cloud-free image as close as possible to the end of 2020 and a recent one. In tropical areas it usually helps to search in the dry season.
- Compare them in natural colour: closed forest, a plantation in rows, bare soil or replanting are fairly easy to tell apart at 10 m.
- Write down the dates of both images and keep a capture of each with the notice "Contains modified Copernicus Sentinel data" and the year.
The image does not replace the layers: it gives them context. If Maryland records loss in 2023 and the 2020 image already shows a plantation in rows, you have an explanation to check with the supplier. If it shows closed forest, you have a problem that paperwork will not fix.
Example: a palm plot with signals that do not match
This is an invented case with example figures. Example Imports Ltd buys palm oil from a cooperative in Indonesia. One of its plots covers 12 ha. The JRC map sees no forest in 2020, Maryland records tree cover loss in 2023 on about 3 ha and Whisp rates it as high risk.
First, the geometry: the polygon falls on the farm the cooperative has registered with its STD-B. Then the images: the October 2020 one shows mature palms in rows across the whole plot, and the 2023 one shows the same 3 ha cleared and replanted. The cooperative provides its 2023 replanting plan and photos of the young palms.
Conclusion: renewal of a plantation that already existed in 2020, not deforestation. The importer writes the justification, keeps both images with their dates, the replanting plan and the result of each source, and leaves the plot in the batch. Had the 2020 image shown closed forest on those 3 ha, the plot would have come out of the batch.
How do you document the decision?
The Regulation asks for more than a yes or a no. The information has to be conclusive and verifiable (Art. 9(1)(g)). The risk assessment takes into account, among other criteria, the reliability and validity of that information (Art. 10(2)). If the risk is not negligible, it has to be mitigated with adequate measures, such as requiring additional information or documents or carrying out independent surveys or audits (Art. 11). And all of it is part of a due diligence system reviewed at least once a year (Art. 12).
In practice, for each plot in doubt it is worth putting in writing:
- The geometry checked and the date of the check.
- What each source said, with its version or data date.
- The images you looked at, with their dates.
- The supplier's explanation and the documents behind it.
- Your conclusion, who made it and when, and whether the plot stays in the batch, comes out or waits for a measure.
That record is what you will show if an authority asks why you considered the risk negligible. How it fits into the risk assessment and into a valid DDS is in their guides.
How does Sourevo do it?
In Sourevo each plot is looked at by three independent sources: the Global Forest Watch layers, FAO's Whisp and Copernicus Sentinel-2 imagery. We tell you where they agree and where they do not, with a link to see the plot yourself, and what you explain stays in the DDS record together with its proof.
You can try it with a real supplier's plots for 14 days, free of charge.
Frequently asked questions
- Is one source enough to clear a plot?
- It is not advisable. Each source has a blind spot: the JRC map does not see changes after 2020 and Maryland's loss does not tell a plantation harvest from deforestation. With two or three sources that agree, and the image when they do not, the conclusion stands much better.
- Is it mandatory to use satellite imagery?
- The Regulation does not impose any dataset. It requires conclusive and verifiable information that the product is deforestation-free (Art. 9(1)(g)). Satellite layers and images are the most direct way to get it for each plot, and the JRC states that its map is neither mandatory nor exclusive.
- Can I keep Sentinel-2 images in my record?
- Yes. Copernicus data are free and open. When you use them, state that they contain modified Copernicus Sentinel data and the year of the images.
- What if the plot was fine at submission and an alert appears later?
- Review the alert with the same method. If the new information indicates that the product may not comply, Article 4(5) requires the operator to inform the competent authorities immediately.